
Campus users can obtain a report of all their transfer path core courses via the editing dashboard. To access the reports, follow the steps outlined below.
Report Viewing
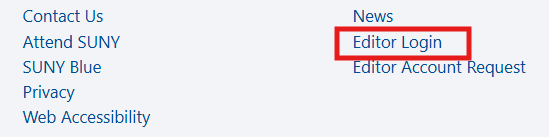
(1) Login to the campus editor dashboard by accessing the link in the footer of the STEP website.
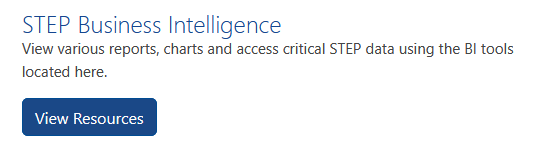
(2) Once logged in, access the STEP Business Intelligence menu item on the Editor Dashboard.
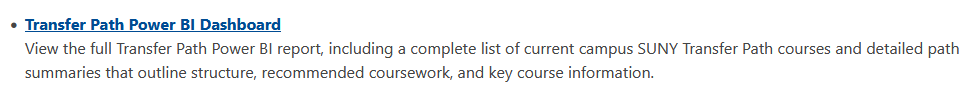
(3) Select the Transfer Path Power BI Dashboard.
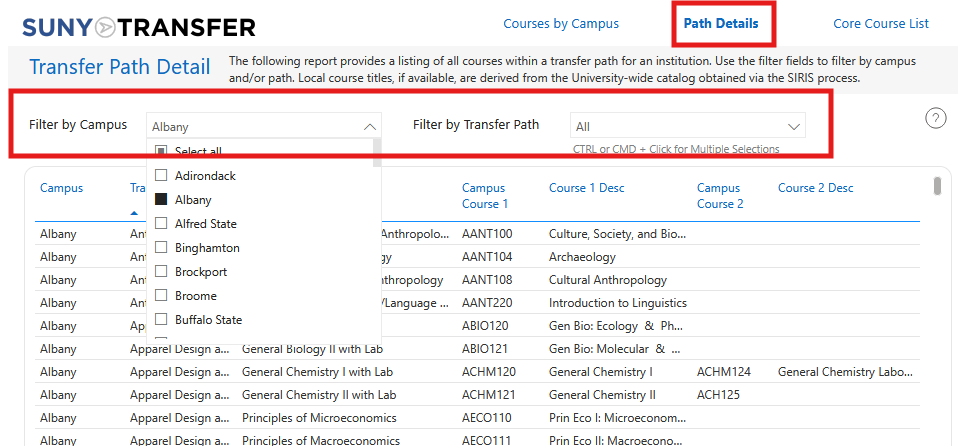
(4) The dashboard will display all core courses at all campuses by default. You may filter by campus(es) and/or by core course(s) as needed using the drop-down menus. Select CTRL or CMD + Click to select multiple campuses and/or multiple core courses.
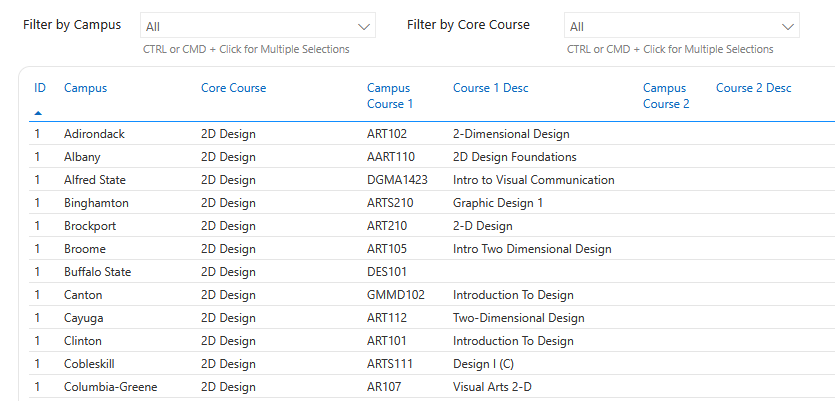
(5) You may also obtain a report of all courses within a Transfer Path for an institution using the “Path Details” link. Select CTRL or CMD + Click to select multiple campuses and/or multiple Transfer Paths.
Advanced Functions
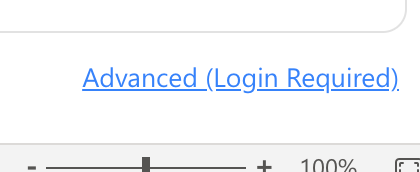
If you would like to perform advanced functions, such as data summarization, analysis, and data downloading, select the “Advanced” link in the bottom right of the dashboard. This will use your SUNY Federation credentials to log you into Fabric PowerBI.
To download data within the report, follow the steps below:
(1) Select the results you wish to export using the filter options in the dashboard.
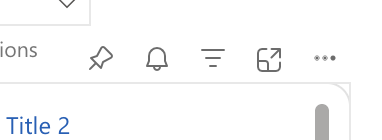
(2) Hover over the top right corner to reveal a context menu. Click the three dots (…) to show an advanced menu.
(3) Select the “Export Data” option on the menu.
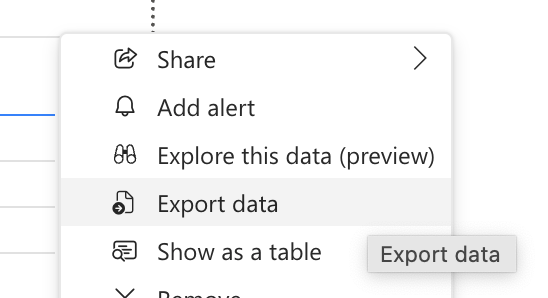
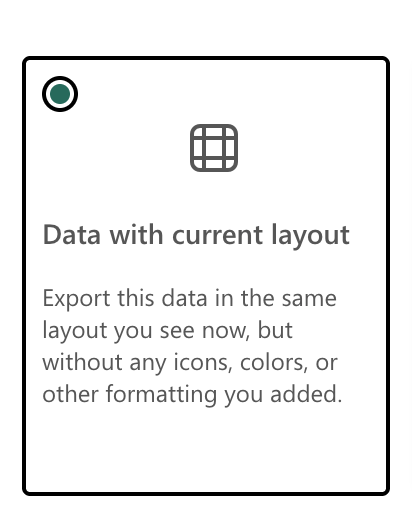
(4) Select “Data with Current Layout” and click the “Export” button to download a file in the .xlsx (Excel) format.

Contact our office for assistance!